There are lots of phishing awareness programs dedicated to giving employees the tools they need to recognize phishing scams. To prove their program’s effectiveness, companies often highlight their click rate. But how much is the click-rate alone telling you about your organization’s phishing risk?
Most research agrees that awareness training followed by embedded phishing exercises reduces employee’s susceptibility to phishing. How should a company design a sound evaluation to phishing awareness showing its effectiveness? Currently, little or no research has explored possible factors that might bias results, such as differing levels of persuasiveness of the phishing message or other issues. As a result, companies have to create their own general phishing campaign, with no framework to guide their efforts.
So how do you rate the success of a phishing awareness program?
The click rate is used as the benchmark to understand if a training program is working or not and what the current threat level is. But how much is it really telling you? Is the click rate alone a metric you can rely on to give an accurate picture of the risks imposed by your employees’ behavior?
Or, are we falling for the same bias as decades of baseball fans do on home runs hit? By narrowing our perspective to one lone measurement in hopes that it will provide simple, at-a-glance insights, we fail to see the entire, and far more accurate, picture.
To illustrate, let’s look at two companies, Companies A and B, both of which have 100 employees each. Each company has 10 employees failing for phishing simulations every month, which yields a constant 10 percent click rate year round at both companies. This rate implies no improvement at all at either company.
But here’s the catch; At Company A, it’s always the same 10 employees clicking links and falling for the simulation. This means that 90 employees were aware and ready for phishing emails in the first place; 10 have not improved at all, which can be seen by looking at the click rate. But over at Company B, it’s always different people falling for simulations, and here is the differentiating factor: no employee falls for the simulations more than once.
Here at company B, we have a great learning achievement, but it’s one that cannot be deduced by looking at the click rate alone. Though the click rate remained the same at both companies, the level of learning and internalizing the message of the program was entirely different.
We conducted phishing training using a known vendor which provided our phishing campaign with predefined emails. We were allowed to pick the types of emails like IRS, Cellular plan, Sports, Certify, Order, shipping and Fax. We setup 6 campaigns for the whole company scheduled over 3 months.
So, if you can’t trust your click rate alone, how can you accurately measure success? What metrics should you be using in combination to create one complete and accurate picture of whether your training program is meeting its goals or not? How can you determine if your employees are really becoming ever-more successful in avoiding phishing attempts with each iteration?
To make an accurate determination, you’ll need to assess the time period, variety of emails and the population receiving the emails to create an accurate overall picture. Let’s look at how using each of these metrics provides an accurate understanding of how your own team is doing.
Compare the results of, for example, the sixth simulation with the results of the third simulation. This helps determine if your employees are internalizing the messages of the training more over time.
No two phishing scams are exactly the same, you need to determine how employees perform on a wide range of emails rather than with the same templates over and over. You need to determine the persuasiveness of phishing emails for average untrained users. Higher persuasiveness emails are spear phishing emails. On average, if you would include spear phishing level emails in the campaign your open rate would increase by 70 percent. The general phishing email would have an open rate of 3 % per the Verizon Data Breach Report 2019.
Simply higher click-through rate on phishing links in a phishing email means higher persuasiveness of the phishing email. For example, they may know to be wary when it comes to emails messages with perceived benefits, i.e. “Click here to redeem your free trip to Cancun!” Threatening emails, on the other hand, that appear to come from the CEO or IT department may elicit a different responses and reaction.
Spear Phishing key characteristics compared to general campaign emails:
Blended/multi-vector threat – Spear phishing uses a blend of email spoofing, dynamic URLs and drive by downloads to bypass traditional defenses.
Multi-staged attack – The initial exploit of systems is the first stage of an advanced persistent threat (APT) attack that involves further stages of malware outbound communications, binary downloads, and data ex filtration.
Lack characteristics of spam – Spear phishing email threats are targeted, often on an individualized basis, so they don’t bear a resemblance to the high-volume, broadcast nature of traditional spam.
Employees come and go, so determine if you’re looking at the same group of people or if there are new employees to take into account. Newer employees don’t have the same amount of learning under their belt. Therefore, it’s not fair nor realistic to expect the same level of maturity in learning as employees who have been going through the simulation process for a longer period of time.
These metrics are just the beginning; there are more that need to be tossed and turned over to really understand your organizational risks and successes. But knowing that the click rate alone isn’t enough is the first step to getting that clarity.
When it comes to helping your organization avoid phishing attacks, you need science rather than intuition to guide your efforts. Now is the time to abandon your click rate fixation and begin to understand if your phishing awareness efforts are really working or not.
“The major questions regarding the effectiveness of a phishing exercise: “Did the organization or individuals within it become more resilient to phishing attacks? And, if so, by how much?”
Raw data on the performance of individuals during these phishing campaigns cannot be directly used to answer these questions with any real certainty. The following example case from a dataset explored in these 6 campaigns illustrates the challenge. A group of 20 started out with 35.9% of participants being phished in exercise A. The phished rate then dropped to 1.9% and 2.4%, respectively, in exercise B and C. Exercise D shown an increase to 19.4%.
Similar fluctuations in performance are observed in the other test groups. The reason for these irregularities become evident when we consider the click-rate of each email type in the six phishing exercises. For example, when comparing “Lottery” and “Complaints” email types in Table 2, we see that the former never receives more than a 0.8% click-rate, while the latter achieves a click-rate of up to 26%. This shows that the changes in click-rates in different rounds are correlated with the inherent persuasiveness of the phishing emails.
Therefore, drawing conclusions about the effect of exercises based only on trends in the raw click-through rates of different emails can lead to erroneous conclusions.
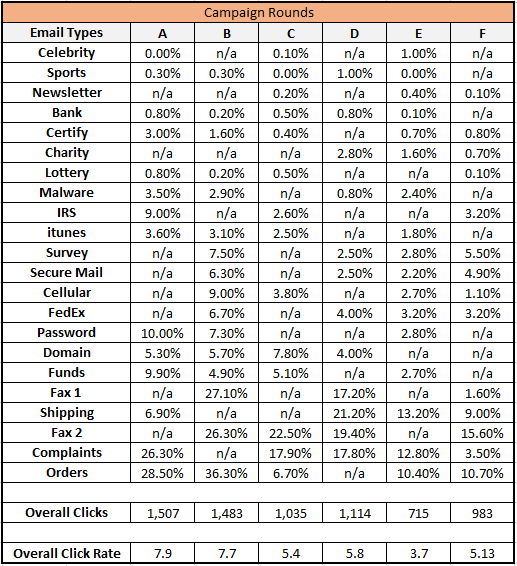
Table 2 Combined click-through rate for each email type across all populations for six campaigns. Some fields are marked as “n/a”. The n/a indicates that the emails were not given to any of the groups in that campaign. Last rows summaries the number of clicks on phishing emails as well as overall click-through rate in each round.
Many companies are focused on the overall click-through rates, as it presumably indicates the effectiveness of their embedded phishing training in reducing the susceptibility of their employees to these attacks.
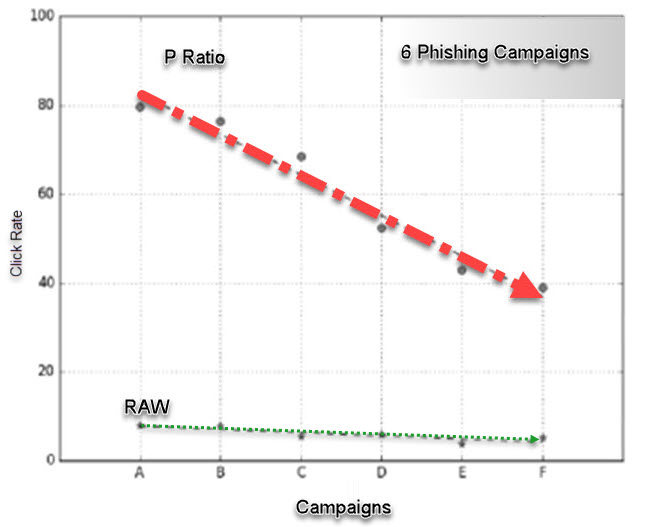
The easiest way of measuring this rate in each round is to compute the percentage of participants who click on phishing links. Applying this approach to our example data, one may conclude that the overall RAW click-rate only decreased from 7.9% in the first round to 5.13% in the last round of the phishing exercise (See Table 1), a drop that is not particularly significant. This method gives the impression that employees are moderately protected at 5.3% click-through rate. However, a closer look at the data shows that the click-through rate has not changed uniformly for all types of emails. For example, the click-through rate on “Order” emails in the first round were 28.5%, and decreased to 10.7% in the last round. In comparison, the click-rate of the “Certify” email changed from 3% in the first round to 0.8% in the last round. You can conclude that solely considering the raw click-through rates would not allow the company to fairly interpret the observed trend.
We determined the click rate by using a P-ratio will better suit normalizing the click-through method.
P-ratio. This method scales the click-through rates on a link inside a phishing email linearly relative to the email persuasiveness. Rescaling is done by dividing the click-through rate by the corresponding persuasiveness score of email.
We based the persuasiveness scoring on Cialddini’s principles. In order to conduct the analysis, we established our decision making to classify which persuasive elements exist in a phishing email.
Using the P-ratio method, we normalized the click-through rates and then, computed the overall click-through rate for each round. This was done by averaging the normalized click-through rates for all phishing tests in that round.
Table 1 shows the overall click-through rate in different rounds computed in this way. For comparison, the figure also shows the average raw click-through rates in different rounds. According to the P-ratio, the susceptibility (i.e., click-through rate) of the employees has decreased from 80% in the first round to 40% in the last round. The normalized click-through trend shows a steady improvement over the course of the exercise.
Using the P-ratio method, we find that the improvement from training seems to be limited to more persuasive phishing emails (spear phishing) and there is no improvement for unpersuasive phishing emails. Based on the findings we can recommend designing a spear phishing exercise will likely increase their efficiency and effectiveness. The objective being to establish better embedded phishing training exercises that will in turn cause companies to be more resilient to phishing attacks.